

Blind Source Separation of Moving Sources Using Sparsity-Based Source Detection and Tracking
Maja Taseska and Emanuel A. P. Habets
Published in the IEEE/ACM Transactions on Audio, Speech and Language Processing, Vol. 26, Issue 3, pp. 657-670, Mar. 2018.
Abstract
Sparsity-based blind source separation (BSS) algorithms have received a lot of attention due to their low complexity and noise reduction capabilities. The underlying assumption is the existence of a signal domain where the source signals are sparse, such as the short-time Fourier transform (STFT) domain for speech signals. The main task in STFT-domain sparsity-based BSS is the association of each time-frequency (TF) bin, to the dominant source at that bin, which can also be interpreted as an unsupervised clustering problem. In many applications, it is desirable that BSS offers invariable quality for moving sources, which requires simultaneous source tracking and BSS. Clearly, repeating the clustering on sliding data windows naturally results in a multi-source tracker. However, such clustering-based approaches are sub-optimal and do not exploit concepts from optimal Bayesian tracking. Meanwhile, existing Bayesian trackers use fullband measurements, such as time-differences of arrival, that are not useful for sparsity-based BSS, where narrowband measurements for each frequency bin are required. In this paper, we develop a tracker based on a narrowband measurement model, where the measurement-to-source association probabilities estimated by the tracker at each TF bin, are used to estimate the statistics of the source signals. Subsequently, BSS is achieved by informed spatial filters computed using the estimated statistics. The proposed framework allows for joint treatment of speech presence uncertainty and time-varying number of sources, while requiring at least two spatially separated microphone arrays, with known microphone positions and relative orientations.
Audio Examples from real measurements: proposed method versus auxIVA
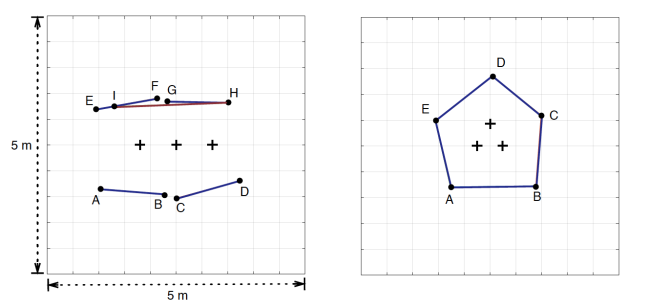
Figure 1: Measured scenarios for evaluating BSS performance. The line segments denote the approximate source trajectories (traversed multiple times), and the crosses denote the arrays. The exact trajectories for each experiment are stated below.
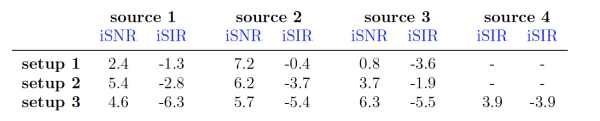
Table 1: Signal-to-noise ratio and signal-to-interference ratio at with respect to each of the sources in the different experimental setups (see the description for the audio examples below) at the corresponding reference microphone.

Setup 1
Three sources from the measured scenario Figure 1 (left): female english speaker traverses A-B, male german speaker traverses C-D, and male french speaker traverses H-I.
Setup 2
Three sources from the measured scenario Figure 1 (right): female french speaker traverses B-C, male english speaker traverses A-B, male french speaker traverses E-D.
Setup 3
Four sources from the measured scenario Figure 1 (right): male german speaker traverses A-B, female english speaker traverses C-D, male english speaker traverses G-H and male french speaker traverses E-F.
True source trajectories versus estimated trajectories
Although the accuracy of the estimated source locations is not a major determining factor for the quality of the separated signals, for completeness of the evaluation, we investigate the tracking accuracy. We use simulated data for this experiment, as in this manner the true location of the sources is perfectly known, which is otherwise difficult to obtain on a per-frame basis in real measurements. In future work, it would be interesting to compare the tracking accuracy of the proposed tracker to different families of trackers, such as for instance particle filters. In particular, if the location estimates are to be used for different purpose than steering fixed spatial filters , e.g. for automatic camera steering, comparison of different trackers would be of interest. The results comparing the x and y coordinates of the true trajectories to the estimated ones, are illustrated in Figure the experiments below for several simulated scenarios, as illustrated in Figure 2.
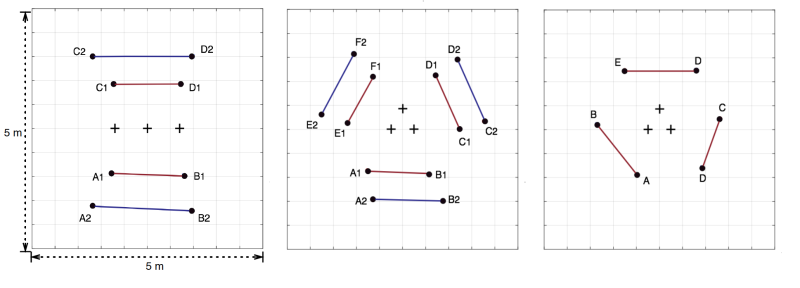
Figure 2: Simulated scenarios for evaluating tracking accuracy. The line segments denote the source trajectories (traversed multiple times), and the crosses denote the arrays. Trajectories with different color correspond to different simulations.
Experiment 1
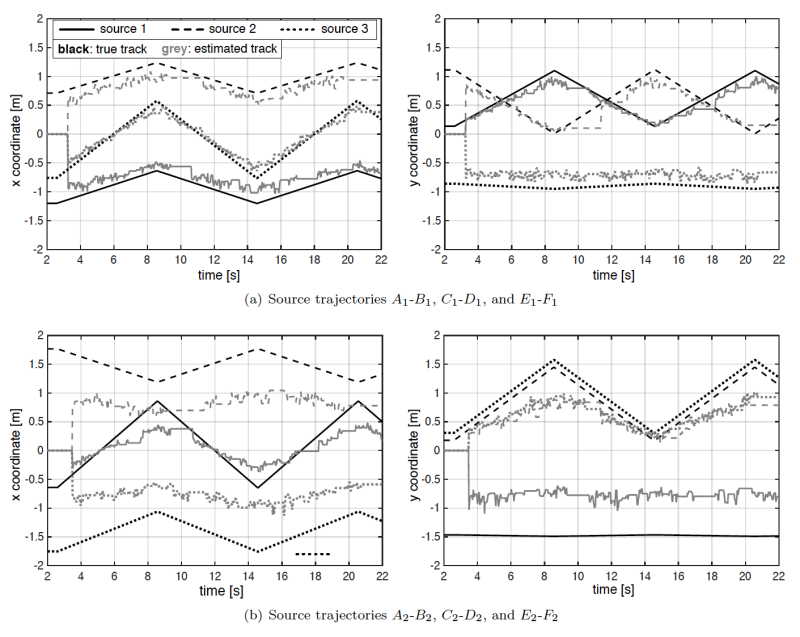
Figure 3: Tracking trajectories for scenario in Figure 3 (middle). SNR with respect to each source was 9 dB on average, with babble background noise. Source velocities were in the range 0.2-0.25 m/s.
In Figure 3, we illustrate the tracking performance for the two sets of trajectories in Figure 8.3 (middle), for T60 = 0:2 s. One observation is the tendency of the tracker to localize sources nearer to the arrays than they actually are, where the bias increases when the sources are far from the arrays. This is due to the nature of the triangulation, where the density of localizations increases in the array vicinity.
Experiment 2
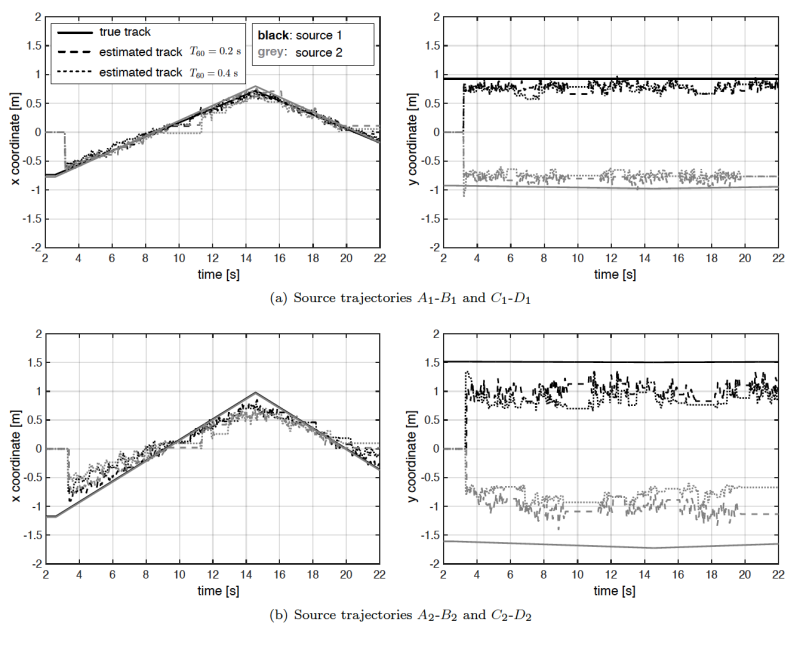
Figure 4: Tracking trajectories for scenario in Figure 3 (left). SNR with respect to each source was 9 dB on average, with babble background noise. Source velocities were approximately 0.12 m/s.
The results indicate that the larger reverberation has only a minor effect on the estimated tracks.
Experiment 3
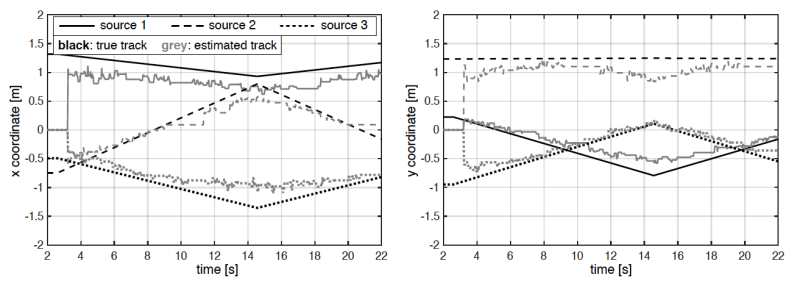
Figure 5: Tracking trajectories for scenario in Figure 3 (right). SNR with respect to each source was 9 dB on average, with babble background noise. Source velocities were approximately 0.12 m/s.
Localization is more prone to triangulation errors due to the relative position of the sources with respect to the microphones. Nonetheless, even in this situation, there is no notable degradation in the tracking accuracy, when compared to the scenario evaluated in Experiment 1, which had similar source-to-array distances and the same T60.
Experiment 4
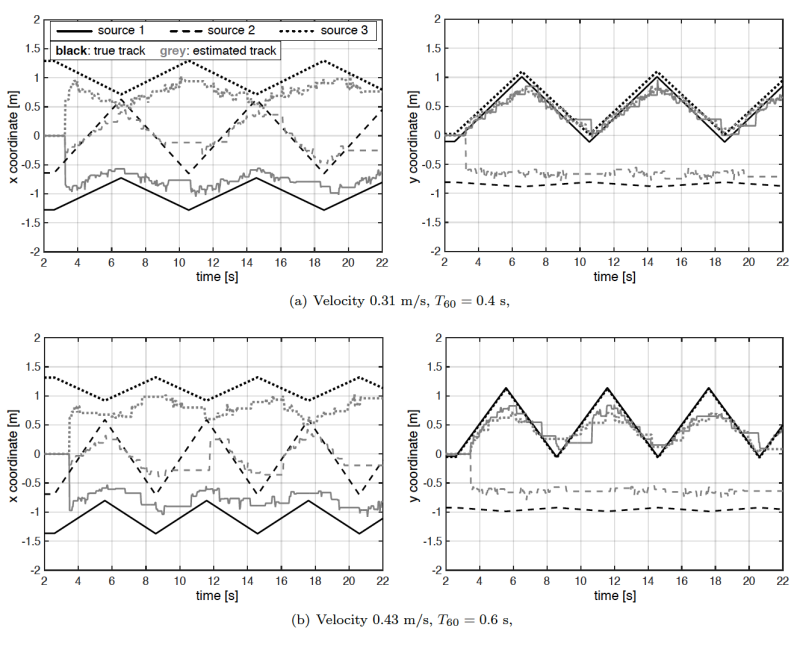
Figure 6: Tracking trajectories for scenario in Figure 3 (middle), for the sources traversing the trajectories nearer to the arrays. iSNR with respect to each source, 9 dB on average, with babble noise. The experiment is done for two reverberation times, and different source velocities.
Estimated tracks in more challenging acoustic conditions with reverberation times T60 = 0:4 s and T60 = 0:6 s, and higher source velocities compared to the previous experiments. Besides the aforementioned bias to localize the sources nearer to the arrays, which increases with larger reverberation, it can be concluded that the tracker operates robustly for different reverberation times, tested up to 0.6 s, different source velocities, and relatively noisy conditions.

Example videos from measured scenarios
Legend
- The line segments denote the true source trajectories.
- The ellipses are the 90% probability mass ellipses of the estimated prediction error covariance matrices.
- The gray disks denote the microphone arrays (with three microphones per array).
- The dark markers denote position measurements associated to sources, the light markers denote position measurements associated to clutter.